Session 3
Resource Allocation
This session aims to introduce you to concept of resource allocation and highlights its importance for health systems.

Activity 2.2.1


Activity 2.4.3: Read this article about resource allocation, for our critique during the tutorial
Eagar, D., Cooke, R., Levin, J., & Wolmarans, M. (2014). Developing an approach to accounting for need in resource allocation between urban and rural district hospitals in South Africa. South African health review, 2014(1), 101-114.
The public health system has struggled to deal with persistent structural inequities in the resourcing and provision of care. The main reason is that resource allocation from the provincial level to districts and facilities does not adequately adequate for need. This paper explores an approach for accounting for need in the assessment of equity in resourcing based on the Principal Components Analysis. The rural index that is developed accounts for differences between rural and urban contexts with regard to healthcare need, as well as the demographic, geographic and socio-economic factors that play a role in determining relative resource needs.
PCA is a statistical method commonly used in testing and selecting variables in the construction of composite indices; the Human Development Index and indices of relative deprivation are good examples of its application. PCA is used to test how variables are associated and change in relation to one another and is a useful approach in assessing the suitability of data and excluding variables that do not contribute meaningfully to the index.
This rural index should be used in conjunction with a broader analytical framework for assessing a facility’s performance against key input, utilisation and resourcing outcome indicators. In this way, the rural index becomes a component of a performance management framework that addresses not only issues of equity (between rural and urban settings), but also efficiency and effectiveness.
With provincial health departments responsible for decision making for the apportioning of resources. The Equitable Share Formula (ESF) was the primary mechanism for promoting equitable budget allocation for each province. Unconditional transfers (as opposed to conditional grants) are determined by the ESF (Edoka & Stacey, 2020). It consists of six components - education, health, basic, institutional, poverty and economic components (Edoka & Stacey, 2020). Collectively, the education and health component account for ∼75% of total transfers to provinces (Edoka & Stacey, 2020).
Conditional grants are received from the national government to deliver specific programmes and services (and capital investment) as stipulated by the conditional grant. These account for about 20% of total transfers to provinces and ensure that the national government can priorities certain diseases burdens, such as HIV. The need for such services determines the size of each province's conditional grants (Edoka & Stacey, 2020).
This mechanism used population size in combination with measures of relative need for services, such as healthcare and education (Eagar et al., 2014). However, questions were raised about ESF ability to ensure meaningful inter-provincial and intra-provincial equity in healthcare expenditure. This included how the ESF did not account for historical backlogs in social and economic infrastructure. While it included a poverty component which is meant to support its redistributive bias, it only accounts for 3% of the formula and it is also outweighed by the economic output component that is biased towards more economically active provinces. Intra-provincial equity is limited by the formula because provinces have discretion in the division of revenues, thus limiting equal distribution among line departments, districts and local municipalities. This means that even when provinces receive and equitable share of resources, there is no obligation to allocate them equitably and no guarantee that healthcare will receive its fair share of the revenue.
There has been slow progress towards more equitable sharing of resources at the inter-provincial level. Yet achieving intra-provincial equity has been less consistent.
Data shows that per capita PHC expenditure is highest in the least deprived quintile health districts and lowest in the most deprived health districts. Thus PHC expenditure is greatest in districts where the need is the lowest and lowest in the districts where the need for health is expectated to be the greatest. Achieving equity between districts is more difficult because provincial departments are not obligated to allocate budgets based on any determination of need. Thus in the absences of regulations, processes and guidelines fostering needs-based allocations, inter-provincial and intra-provincial allocations are determined historically and incrementally.
Historical and incremental based budgeting sustains an infrastructure inequality trap, where pre-existing hospital infrastructure and a relatively high proportion of healthcare workers are often the primary factors in determining allocations rather than an assessment of need. This is the reason for apartheid era structural inequalities to persist.
Exploring the Development of a Rural Index
One of the challenges in promoting the equal allocation of resources for service delivery lies with the complexity in accounting for the differences in the need for care.
The government has tried to introduce performance-based budgeting as an alternative to needs-based budgeting. Capacity constraints and the questionable quality of performance data have inhibited this approach. Thus, the government still largely relies on historical and incrementalist mechanisms to budgeting. While similar approaches have been developed with varying degrees of complexity, [10,12,18–21] ours is unique in that we attempt to account explicitly for differences in resource needs between urban and rural contexts.
There is comprehensive data showing that rural areas tend to have a greater need for healthcare than urban areas: They have disproportionately larger numbers of elderly and children (working age adults move to the cities for employment); poorer (more vulnerable to the social determinants of health and have fewer means to access care). As a result, rural areas carry a greater burden of communicable and non-communicable diseases.
Another challenge is that “rural” has not been defined by the government, the health system or as a proxy measure (such as relative deprivation), and thus, assess the needs for healthcare and resources provisioning becomes more difficult to assess between rural and urban. Proxy measure and relative deprivation have shown to have some analytical value, but this approach lacks the complexity to explain how various factors combine to influence resource needs and differences in access to care. Therefore, critical to the rural index is the classification of selected units of analysis (province, district, municipal ward or facility) as either rural or urban.
The ultimate value of any index is the extent to which it is able to explain trends in selected dependent variables. In this context, how well was the rural index able to explain the differences in per capita budget allocations between district hospitals (this is often used in the analysis of health system financing and decision-making), cost per Patient Day Equivalent (PDE) and the availability of doctors (numbers of doctors working at the hospital per 10 000 population?
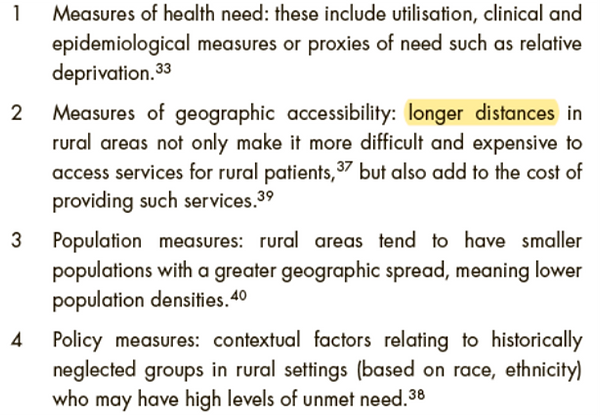
The variables/factors used to define rural can be grouped into four categories:
Component/feature variables in the development of the rural index were based on these four categories.
Regression analysis was used to determine a statistically significant relationship between firstly the rural index and the outcome variable, and secondly the component variables of the rural index and the outcome variables.
Cost-Effectiveness Analyses
This is a globally accepted as a crucial tool for making resource allocation decisions within healthcare systems. Cost-effectiveness analyses compares the cost and health benefits of competing health interventions, to assess whether an intervention represents good value for money. Cost-effective interventions are identified by comparing the incremental costs per health unit gained (or incremental cost-effectivenss ratio (ICER)) to a benchmark value or a reference ICER. This benchmark would represent the cost-effectiveness threshold. Interventions with IECRs below the threshold are considered cost-effective, representing good value for money. These threshold are important for making resource allocation decisions and have been used in many countries for this purpose.
In many LMICs, WHO’s recommendation of three times a country’s GDP per capita per disability-adjusted life year has been the most utilised criteria for determining whether interventions are cost-effective. Yet in recent years, these approaches have been criticised for lacking scientific underpinnings to justify their continued in making resource allocation decisions. This has resulted in calls for empirically estimated context-specific thresholds (Newall et al., 2014; Marseille et al., 2015; Bertram et al., 2016; Leech et al., 2018). Decisions based on inappropriate cost-effectiveness thresholds can result in inefficient allocation of resources, leading to poorer (net) health outcomes. Some empirically estimating thresholds represent the health opportunity cost of health spending (resource allocation decisions or the value of health that will be given up somewhere in the health system when additional resources are imposed on the health system within a fixed budget. These are estimates of the marginal productivity of the health system and are sometimes referred to as the supply-side thresholds (Claxton et al., 2015; Woods et al., 2016; Edney et al., 2018; Ochalek et al., 2018; Vallejo-Torres et al., 2018).
This happens in instances where decision-makers attempt to maximise population health within a constrained budget, they have to prioritize interventions that will produce positive population net health benefits (interventions producing health benefits that outweigh their health opportunity costs). Thus, thresholds determining whether a health intervention represents good value for money ought to reflect the value of health benefits that will be forgone elsewhere in the health system due to funding decisions. WHO’s recommendations of one to three times per capita GDP thresholds fail to consider these trade-offs, potentially leading to selecting health interventions that result in population net health losses.
This paper aims to estimate a cost-effectiveness (supply-side) threshold that reflects the health opportunity cost of health spending in SA. There are several approach to achieve this, such as the league table approach, which ranks interventions based on their ICERs, from the lowest to highest ICER. The threshold is defined as the ICER of the last intervention that can be funded within an existing budget. This approach requires the identification of the costs and benefits of all interventions. However, in practice, most countries, particularly LMICs, lack data required to estimate ICERs for all potential interventions. Furthermore, methodological differences in the estimation of ICERs for different interventions could limit the interpretation and application of league tables.
The more recent approaches to estimating a supply-side threshold is to identify the health benefits associated with marginal changes in health spending. These thresholds come from estimates of marginal productivity of the health system – the value (quantity) of health is capable of producing for marginal changes in health spending. Several high-income countries have estimated thresholds through this approach. Supply-side thresholds were shown to be considerably less than the one to three times per capita GDP threshold for many LMICs, including South Africa (Woods et al., 2016; Ochalek et al., 2018). These studies relied on multi-country data analysis to estimate marginal productivity and miss the richness of local contextuality.
Cost-effectiveness is practiced as an accounting exercise that quantifies health benefits against health expenditure, such as deaths or disease cases averted, or constructed metrics such as quality-adjusted life-years (QALYs) gained or disability-adjusted life-years (DALYs) averted. This is often expressed as incremental cost-effectiveness ratios as Rands per death averted, rands per DALY averted, or rands per QALY gained. In their 2020 study, Edoka and Stacey analyzed variations in health spending and crude death rates across different provinces, while controlling for various potential confounders. They estimated a health spending elasticity for the age-standardized crude death rate to be −0.223. This means that a 1% increase in health spending per capita would lead to a 0.223% reduction in age-standardized death rates on average. In 2015, South Africa's health expenditure was approximately ZAR 154 billion. Thus, 1% of this amount, or around ZAR 1.54 billion, helped prevent about 1,050 deaths, 34,180 years of life lost (YLLs), 5,880 years lived with disability (YLD), and 40,055 disability-adjusted life years (DALYs) nationally. Based on these figures, the cost-effectiveness threshold was estimated at about ZAR 38,500 per DALY averted, which is equivalent to USD 3,015 per DALY averted, and represents roughly 53% of the GDP per capita in 2015.
This has been used for the planning and budgeting of HIV and TB programmes in South Africa, yet this framework is incomplete in other areas of healthcare provision such as mental health services. Additionally, sometimes international donor will be the drivers of a specific health intervention, much like how PEPFAR has been driving the PrEP process. This involves collecting data about programme outcomes and costs against epidemiological data to inform national government’s decision about which interventions to fund in the conditional grants for HIV, TB and malaria. Thus, budget allocations consider both cost effectiveness and affordability. The implementation or execution of the budget is tracked at all levels throughout the budget year through the continuous analysis of expenditure and performance. Barriers to cost-effectiveness analysis has been the quality of and access to cost and programme outcome data. In general, the quality of HIV and TB cost and programme data has been of higher quality, granularity and completeness compared to data in other disease areas in the public health sector, such as non-communicable diseases.
5. What are the key contextual factors that must be considered in developing a health financing strategy for a country, and how do these factors affect the implementation of sustainable health financing reforms towards achieving Universal Health Coverage (UHC)?
Developing a health financing strategy requires a country to review existing financing mechanism to identify both the major problems and explore solutions to address them. There will be contextual factors outside the health system that affect the feasibility and potential achievements of financing reforms. These contextual factors are country specific such as governance structures and population density. There are three particular factors outlined by WHO’s Health Financing Country Diagnostic that are said to affect all countries and should be part of the situation analysis. These include fiscal capacity, the structure of public administration, and public sector financial management rules.
6. How do fiscal capacity, the structure of public administration, and public sector financial management rules affect health financing arrangements, revenue raising, equity in resource distribution, transparency, and accountability, utilization relative to need, and pooling in a health financing strategy?
The fiscal capacity of a country will represent both the priority given to health through resource allocation decision making and the proportion of health expenditure as a percentage of the GDP. Health authorities can affect the fiscal capacity for health expenditure by arguing and ensuring that health spending is consistent with the overall outlook of public spending in the country and that finance authorities are on board with any new pooling or spending strategies. The structure in which public administration (e.g federalism, decentralisation etc.) is organised is a critical factor in how health financing is conducted. Even though the health department might not be able to affect these system-wide structures, it is important to understand how they function, what is and isn’t permitted and the design of specific sector policies can enable taking up opportunities or avoiding preventable consequence that can affect the health financing strategy. Lastly, public sector financial management rules set restrictions through law and regulations on any proposed health financing reforms.
Eagar, D., Cooke, R., Levin, J., & Wolmarans, M. (2014). Developing an approach to accounting for need in resource allocation between urban and rural district hospitals in South Africa. South African health review, 2014(1), 101-114.
Edoka, I. P., & Stacey, N. K. (2020). Estimating a cost-effectiveness threshold for health care decision-making in South Africa. Health Policy and Planning, 35(5), 546-555. https://doi.org/10.1093/heapol/czz152